Telemetry add-ons #
Optional components that show useful information from the vehicle in runtime.
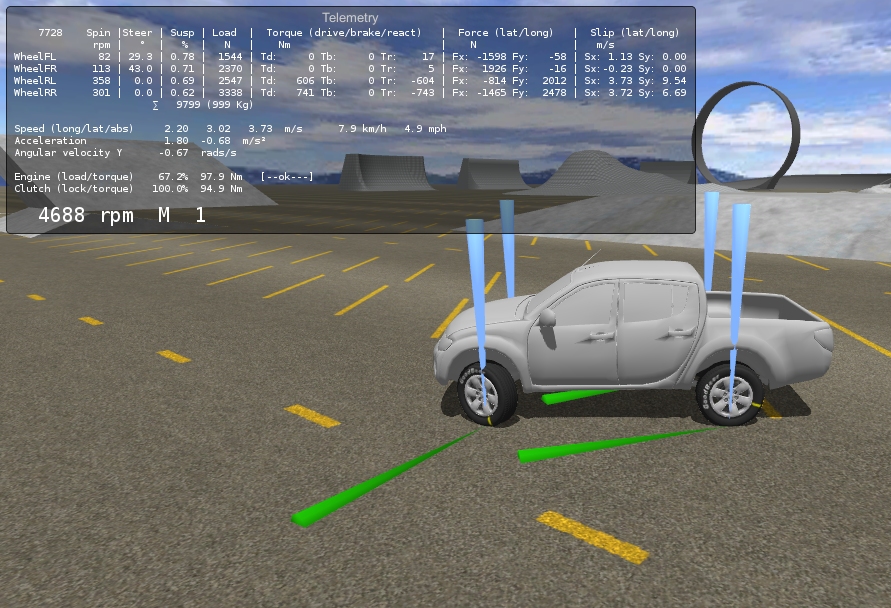
VPTelemetry #
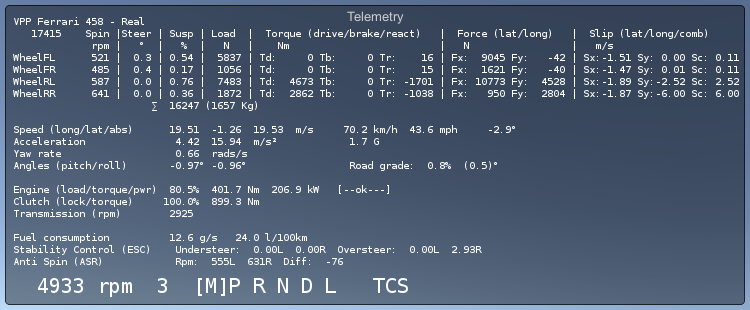
Shows detailed numeric data on the internal state of the vehicle and each wheel in real-time.
- Wheel telemetry
-
- Name of the wheel GameObject.
- Spin rpm (angular velocity).
- Steer: degrees of rotation as per steering.
- Susp: suspension compression percent (%) or suspension distance (m), depending on the option Contact Depth As Suspension.
- Load: wheel load in Newtons (N) or kilograms (Kg), depending on the option Show Load In Kg.
- Torque: torques acting on the wheel in Newtons-meter (Nm): Drive torque , brake torque , reaction torque .
- Force: tire forces in Newtons (N): lateral force , longitudinal force .
- Slip: tire slip velocities in m/s: lateral slip , longitudinal slip , combined slip .
- Vehicle telemetry
-
- Sum of all loads in the wheel, in both Newtons (N) and kilograms (Kg).
- Speed: longitudinal, lateral, absolute in m/s. Speed also in Km/h and mph.
- Acceleration: longitudinal, lateral in . G-force measure.
- Angular velocity Y: turning velocity around the vertical axis, in rads/s.
- Angles: pitch and roll (degrees), road grade (%).
- Engine: load in percent (%), produced torque in Nm, produced power in kW. State of the engine: Off, Stalled, Ok.
- Clutch: lock ratio in percent (%), pass-thru torque in Nm.
- Transmission: rpms at the output of the gearbox.
- Fuel consumption: instant (gr/sec) and liters per 100 km.
- Stability control (ESC): values detected by the sensors engaging the ESC.
- Anti-spin (ASR): values detected by the sensors engaging the ASR.
- Engine RPM, engaged gear, automatic gear position, driving aids currently engaged in the vehicle.
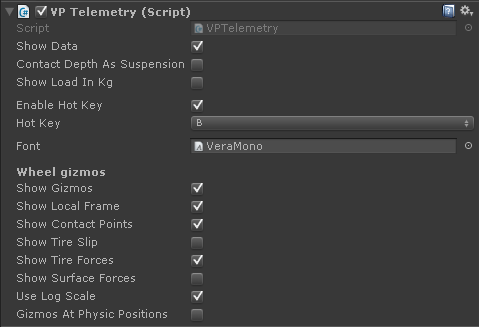
- Show data
- Shows or hides the actual GUI window with the data.
- Contact Depth As Suspension
- Shows the suspension values (Susp column) as compressed distance (m) instead of compression ratio (%).
- Show Load In Kg
- Shows the load per wheel (Load column) in Kg (weight) instead of Newtons (force).
- Enable Hot Key, Hot Key
- Enables a hot-key for toggling the Telemetry GUI window. Default key is B.
- Font
- Font to be used for the telemetry data. Default (recommended) is VeraMono.
Wheel gizmos #
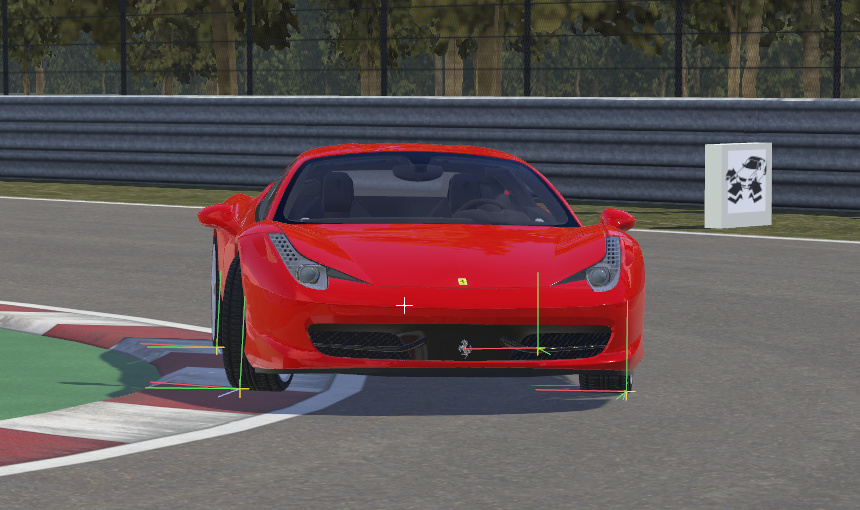
Show different gizmos in runtime representing the state of the wheels. Gizmos are visible in the Scene view and in the Game view with the Gizmos toggle enabled.
- Show Gizmos
- Shows / hides all gizmos
- Show Local Frame
- Local transform of the wheel. Forces and velocities are calculated with that reference frame.
- Show Contact Points
- A crossmark on each contact point.
These gizmos use a colored line for denoting the magnitude and direction of the physic property:
- Show Tire Slip
- Speed the tire is sliding over the surface. It matches the Slip (lat/long) column at the Telemetry.
- Show Tire Forces
- Force being applied by the tire. It matches the Force (lat/long) column at the Telemetry.
- Show Surface Forces
- Forces external to the tire required for keeping the vehicle steady on slopes.
- Use Log Scale
- Magnitudes used for draw the lines are taken in logarithmic scale. Recommended.
- Gizmos At Physic Position
- Draw the gizmos at the positions reported by the Physic engine, without any interpolation nor correction.
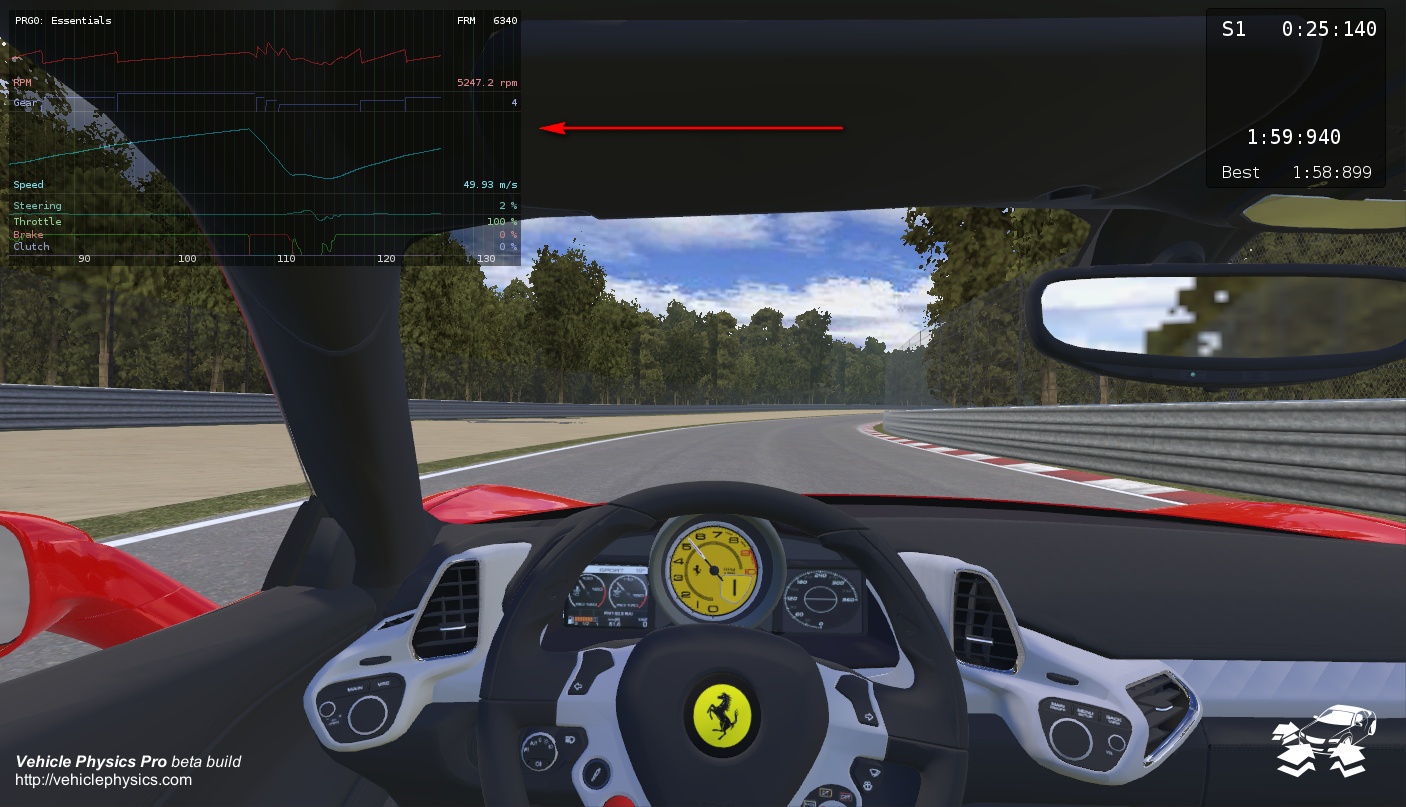
VPPerformanceDisplay #
Advanced data logger and live performance charts for a variety of data coming from the vehicle. The zoom and panning controls allow fully detailed inspection.
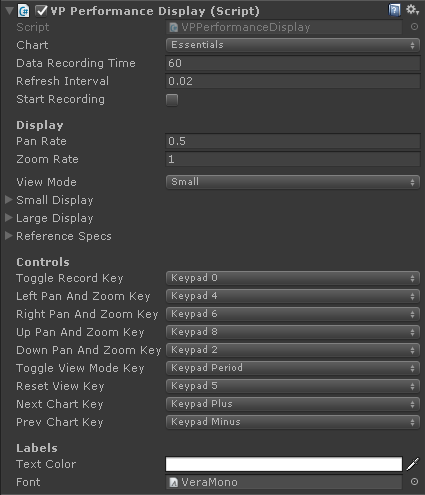
- Chart
- Selected performance chart
- Data Recording Time
- Size of the buffer of the data logger
- Refresh Interval
- Time in seconds between each display refresh. This doesn't affect the rate the data is recorded.
- Start Recording
- Begin data recording as soon as the vehicle is enabled.
- Pan Rate
- How fast are the panning operations
- Zoom Rate
- How fast are the zoom operations
- View Mode
- Select the display size among Small and Large
- Small Display
- Position, size, background color and transparency for the small display mode
- Large Display
- Position, size, background color and transparency for the large display mode
- Reference specs
- Bounds or ranges for several parameters of the vehicle (max speed, max rpm...). This is used for better fitting the charts in the display.
- Controls
- Keys assigned to each operation. Defaults:
- Text Color
- Main color for the labels. Channel colors are tinted with this.
- Font
- Font to be used for the text labels. Default (recommended) is VeraMono.
Performance charts #
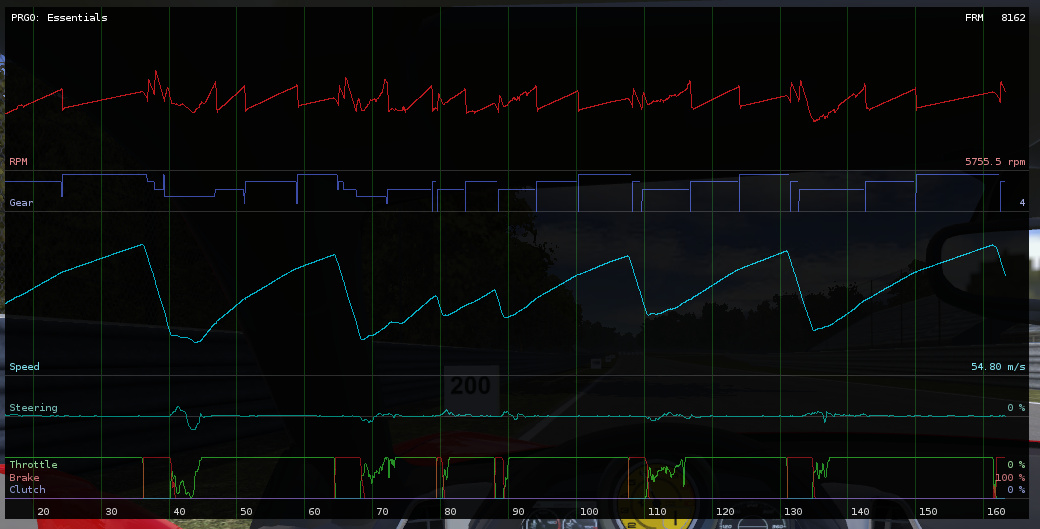
Essentials #
Basic vehicle parameters: engine rpm, gear, speed, steering, throttle, brake, clutch.
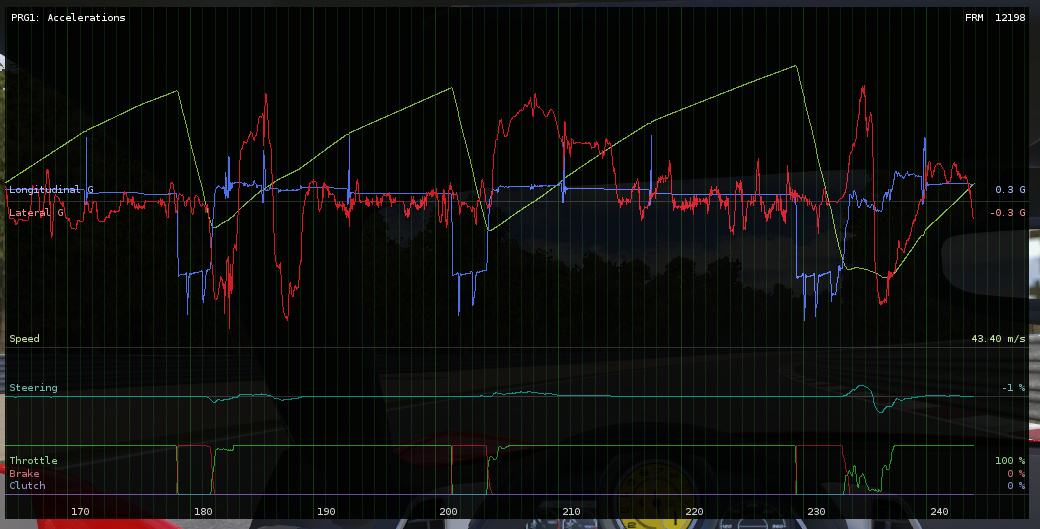
Accelerations #
Longitudinal and lateral accelerations in G factor. Includes the speed trace and the input parameters (steering, throttle, brake, clutch) for reference.
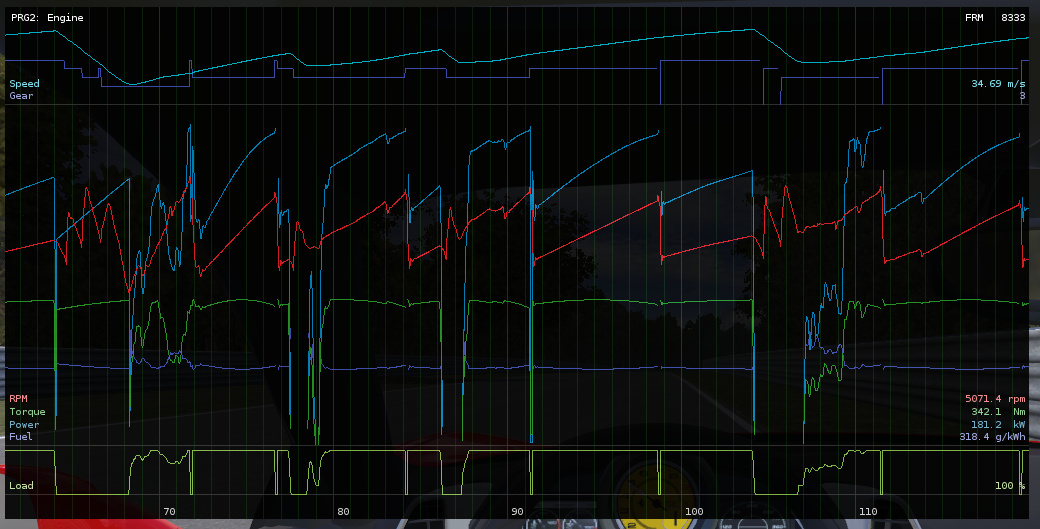
Engine performance #
Parameters related to the engine: rpm, torque, power, specific fuel consumption and demanded load. Includes speed and gear for reference.
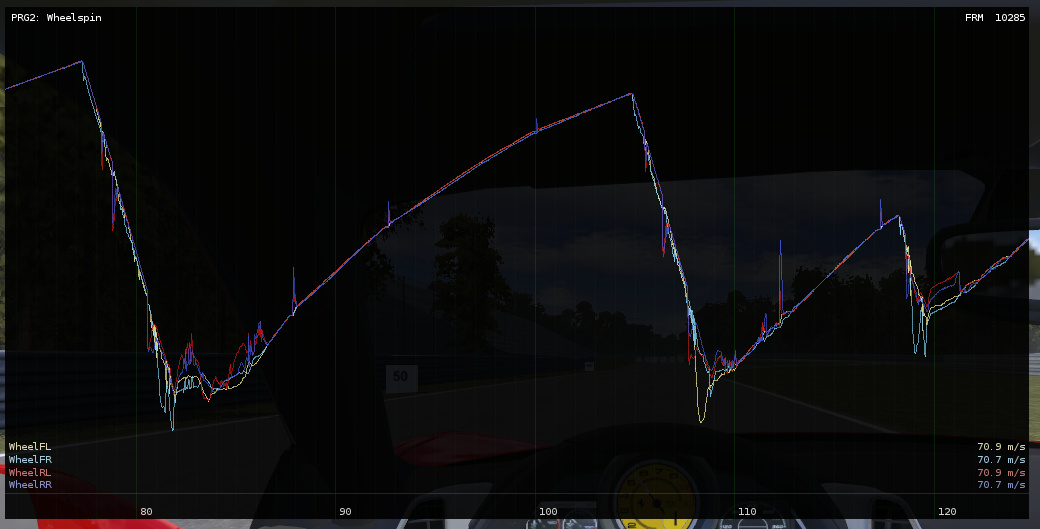
Wheelspin #
Wheel circumference velocity for each wheel. If the wheel is gripping without slipping, then this velocity is the road speed of the wheel. Wheelspin is shown as sharp upward spikes. Wheels locking due to braking are shown as a sharp downward spike.
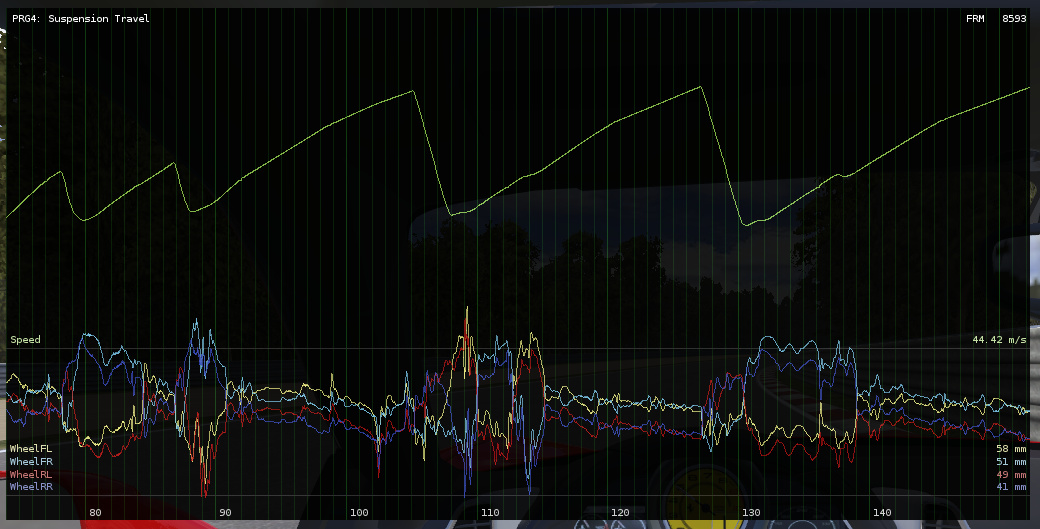
Suspension travel #
Available remaining travel of the suspension for each wheel. If the trace reaches the bottom of the chart (0 mm) then the suspension is fully compressed and has reached the limit. Includes the speed trace for reference.
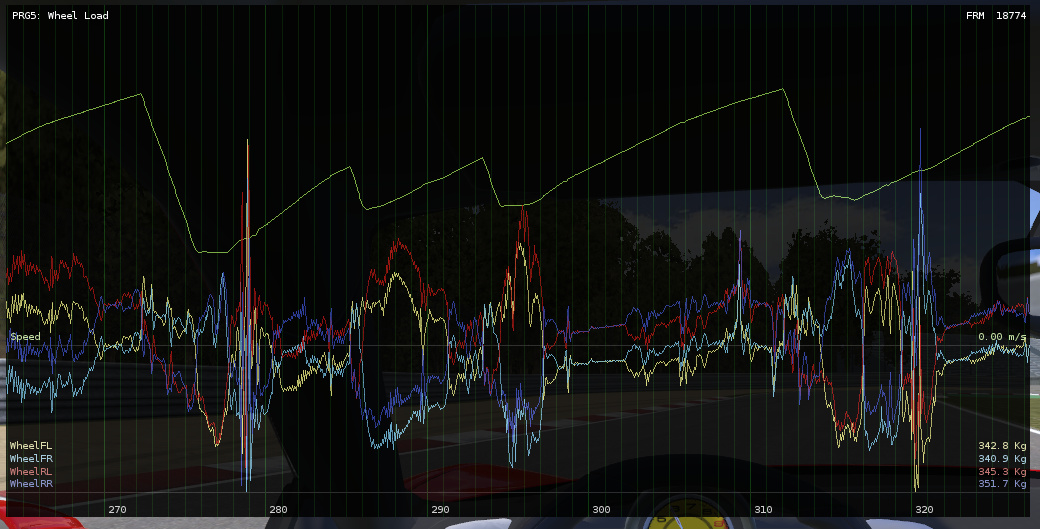
Wheel load #
Load supported by each wheel. Includes the speed trace for reference.
Custom #
You can write your own data logger by deriving from the PerformanceChart abstract class.
Set it at the customChart property of the VPPerformanceDisplay component.
The PerformanceChart class exposes several properties you can use for gather the data and
configure the visualization:
VehicleBase vehicle- The actual vehicle being monitored
DataLogger dataTool- Create and configure the data channels and set up the visualization options
ReferenceSpecs reference- Bounds or ranges for several parameters. Useful for configuring visualization scales.
VPForceCones #
Draws 3D cones starting at the wheel's contact points representing the forces applied by the wheels to the vehicle.
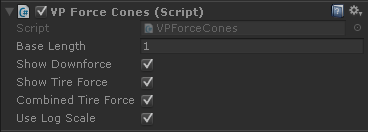
- Base Length
- A reference length for configuring the dimensions of the cones.
- Show Downforce
- Show the downforce at each wheel
- Show Tire Force
- Show the tire forces
- Combined Tire Forces
- Shows a single combined force per wheel. If disables, shows separate cones for forward and sideways forces.
- Use Log Scale
- The magnitudes used for the length of the cones are taken in logarithmic scale. Recommended.